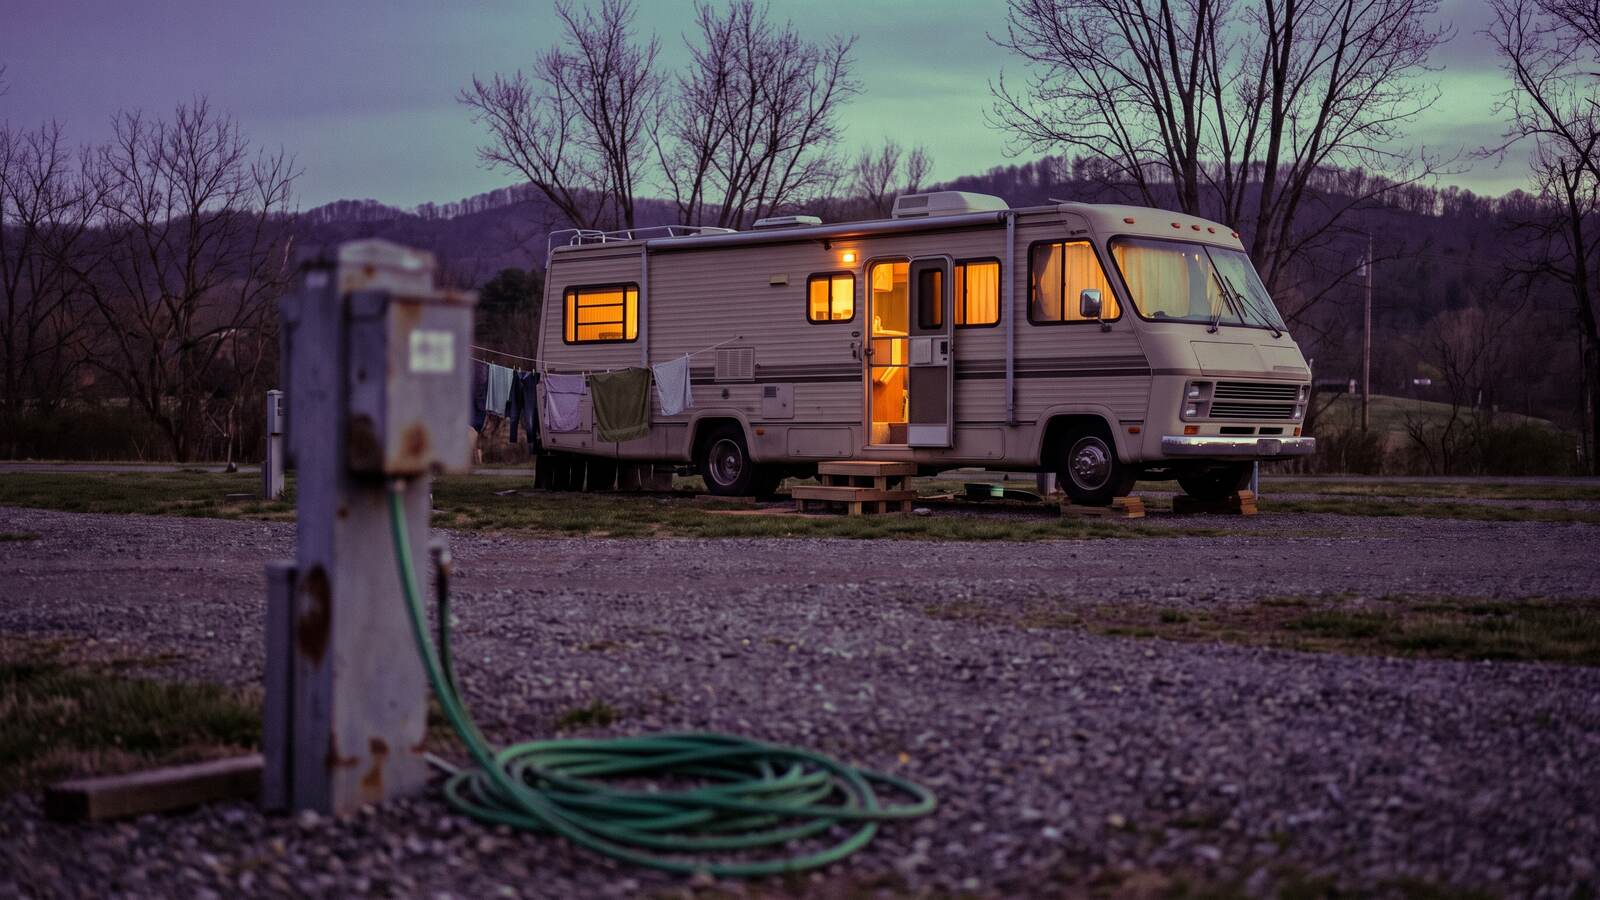
The Local-Tenant Thesis
Why transient occupancy has a ceiling, why it collapses in winter, and who the local tenant actually is.
Module 1 of 104 lessonsWritten in full1 worksheet
The lessons
All 4, in the order they are read.
The worksheet
Occupancy gap calculator
Fill in the first three columns with your park's numbers. The last two columns show what the empty pads are costing you and what the same pads earn once converted. The example row shows how each line is computed; replace the example values with yours.
| Line | Example value | How to get it | Notes |
|---|---|---|---|
| Total pads | 40 | Count every pad with hookups. | Include pads you use for storage or staff; they count as inventory. |
| Pads you keep transient | 20 | Your choice: the best-located, best-view pads. | The model does not ask you to give up the summer business. |
| Pads available to convert | 20 | Total pads minus pads kept transient. | These are the pads the rest of the course is about. |
| Current annual occupancy, transient pads | 65% | Nights sold in the last 12 months divided by nights available. | National average is roughly 65 to 67 percent per https://software.roverpass.com/blog/rv-park-industry-stats |
| Current winter occupancy | 30% | Same calculation, December through February only. | Winter range nationally is 15 to 55 percent per the same source. |
| Transient revenue per pad per year | $4,745 | Nightly rate x 365 x annual occupancy. Example: $20 x 365 x 65%. | Use your real nightly rate. |